Newsroom

2017: all targets announced at the IPO have been surpassed
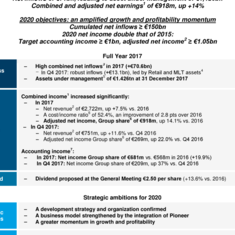
Net inflows of €71bn, leading to asset under management of €1,426bn
Combined and adjusted net earnings[1] of €918m, up +14%
2020 objectives: an amplified growth and profitability momentum
Cumulated net inflows ≥ €150bn
2020 net income double that of 2015:
Target accounting income ≥ €1bn, adjusted net income[2] ≥ €1.05bn
Full Year 2017
|
Business activity |
High combined net inflows [3] in 2017 (+€70.6bn)
Assets under management [5] of €1.426tn at 31 December 2017 |
|
Results |
Combined income [1] increased significantly: In 2017 Net revenue [2] of €2,722m, up +7.5% vs. 2016 A cost/income ratio [6] of 52.4%, an improvement of 2.8 pts over 2016 Adjusted net income, Group share [6] of €918m, up 14.1% vs. 2016 In Q4 2017: Net revenue[2] of €751m, up +11.6% vs. Q4 2016 Adjusted net income Group share[6] of €269m, up 22.0% vs. Q4 2016
Accounting income [7]: In 2017: Net income Group share of €681m vs. €568m in 2016 (+19.9%) In Q4 2017: Net income Group share of €209m, up 37% vs. Q4 2016 |
|
Dividend |
Dividend proposed at the General Meeting €2.50 per share (+13.6% vs. 2016) |
Strategic ambitions for 2020
|
Strategic priorities |
A development strategy and organization confirmed A business model strengthened by the integration of Pioneer A greater momentum in growth and profitability |
|
2020 objectives[8] |
Cumulated net inflows ≥ €150bn from 2018 to 2020 Cost/income ratio [1]≤ 53% Adjusted net income[1] ≥ €1.05bn in 2020, equivalent to average annual growth of c. 7% [9] Dividend pay-out ratio of 65% |
[1] The combined figures aim at presenting economic trends for Amundi after the integration of Pioneer for full years 2016 and 2017. Combined figures therefore include 12 months of Pioneer data.
[2] Adjusted figures exclude amortisation of distribution contracts and costs associated with the integration of Pioneer which are exceptional.
[3] Combined data in 2016 and 2017.
[4] Assets excluding treasury products: equities; bonds; multi-assets; real, alternative and structured assets.
[5]Assets under management and inflows include assets under advisory and assets sold and take into account 100% of assets under management and inflows on the Asian JVs. For Wafa in Morocco, assets are reported on a proportional consolidation basis.
[6] Excluding the costs associated with the integration of Pioneer and excluding the amortisation of distribution contracts.
[7] Accounting figures include Pioneer data only since the effective acquisition date (3rd of July 2017). Therefore, Amundi’s accounting figures include Pioneer data only in the 2nd half of 2017. In 2016 Amundi’s accounting figures do not include Pioneer data.
[8] See details and assumptions on page 7
[9] From a combined and adjusted 2017 net income, including a normalized level of financial income
Paris, 9 February 2018
Amundi’s Board of Directors, chaired by Xavier Musca, convened on 8 February 2018 to approve the financial statements for 2017.
Commenting on the figures, Yves Perrier, CEO, said: “As in 2016, in 2017 Amundi has exceeded the business and financial targets that were set when it was listed in late 2015. These good results confirm the strength of Amundi’s business model, which has been further boosted by the integration of Pioneer in three key areas: distribution capacity, expertise and talent. In this context, the new targets for 2018-2020 provide for acceleration in growth and profitability, with in particular a two-fold increase in net income in relation to the level seen at the time of Amundi’s listing.”
***
I. Full Year 2017
Very strong activity, with assets under management rising to €1.426tn and results up significantly thanks to the integration of Pioneer and to robust activity
In 2017, Amundi saw stronger growth relative to the previous year, with €70.6bn in net inflows [10] and adjusted net income [10][11] of €918m, an increase of 14.1%.
All the targets announced at the time of the IPO in November 2015 have been surpassed:
- Activity: inflows[10] of €131bn in two years (2016–2017), above the target of €120bn in three years.
- Operational efficiency: cost/income ratio of 52.4% [11] in 2017, below the announced maximum of 55% and one of the best in the industry.
- Profitability: average Earnings per Share growth of +12.5% between 2015 and 2017 [12], which is higher than the target (+5% per year) despite the capital increase carried out in April 2017.
- Dividends: pay-out ratio of 65% in 2017, above the announced target of 60%.
These results generated significant value creation for the shareholders of Amundi, whose market capitalisation (€14.1 bn on 6 February 2018) has doubled since the IPO on 11 November 2015. Amundi has become the largest listed asset manager in Europe in terms of market capitalisation and the fourth in the world.
1. Activity in 2017
Combined assets under management reached €1.426tn on 31 December 2017, benefiting from the contribution of Pioneer's assets (+€242.9bn; consolidated from H2 2017), strong inflows (+€70.6bn [10]) and a favourable market effect (+€26.7bn), particularly in equities.
Note: all AuM and inflows below are presented as combined.
Net inflows were strong and diversified. Each client segment, management expertise and region recorded positive net inflows. These were largely driven by strong trends in Retail (70% of the total), the International segment (73%) and medium/long-term products (51%).
Indeed, the Retail segment has seen substantial activity, with net inflows in 2017 of +€49.6bn, achieved across all distribution channels, compared to +€31.5bn in 2016.
- Inflows were robust in the French networks, particularly in medium/long-term products (+€4.4bn), largely thanks to unit-linked life insurance policy subscriptions. This confirms the positive trend observed since the second half of 2016.
- Activity in the international networks (+€10.2bn) was up significantly. This was particularly true in Italy (+€9bn), where large inflows were recorded in the UniCredit networks (+€6.5bn), reflecting an excellent start to the partnership.
- Excellent trends were also observed for third-party distributors (+€17.6bn vs. +€7.3bn in 2016), primarily in Europe, Japan and the United States.
- Regarding joint ventures, inflows remained satisfactory (+€17.8bn) and were particularly strong in China and India.
The Institutionals and Corporates segment recorded solid net inflows (+€21bn in 2017). This figure nonetheless represents a decline from 2016 level (+€28.9bn), a fact attributable to the €6.9bn mandate reinternalized by the ECB in Q1 2017. Excluding this impact, net inflows were almost stable.
All asset classes contributed to net inflows in 2017. Medium/long-term assets represented +€36.2bn (+€43.1bn excluding the ECB mandate). The trends were particularly favourable in the following areas of expertise: ETFs (+€10.2bn[13]), where Amundi has grown two times more than the market [14] in terms of inflows in 2017, real estate (+€4.9bn), emerging market assets (+€7.4bn[13]) and diversified products (+€18.9bn).
Finally, the majority of net inflows continued to come from the international segment (73% of total inflows), encompassing all the regions. Activity was robust in Europe (particularly France, Italy and Germany), the United States and Asia.
2. Results in 2017
a) Accounting income[15]
Accounting income rose sharply in 2017, benefiting from the contribution of Pioneer (consolidated in H2) and the Group's financial performance: accounting net income, Group share (including integration costs and the amortisation of distribution contracts) amounted to €681m, an increase of 19.9% over 2016. Adjusted net income Group share[16] was €800m, up +38% vs. 2016.
b) Combined results[17]
The combined results, which are used to appraise the Group's performance on a comparable basis, increased significantly thanks to solid gains in revenues (including a high level of performance fees and financial revenues) and the improved cost/income ratio.
- Net revenues[18] amounted to €2,722m, up +7.5% on 2016, in line with the increase in assets under management. Performance fees (€180m) recorded strong growth amidst a particularly favourable market environment. Amundi also benefited from considerably high financial revenues (€95m) associated with asset disposals.
- Operating expenses[19] remained under control, increasing only +2.1%; the result was a cost/income ratio[16] of 52.4%, a 2.8-point improvement which included the initial impacts of synergies.
- The share of net income of equity-accounted entities (essentially Asian joint ventures) rose significantly (+16%, in line with assets under management), to €33m.
- Taking into account a tax charge[16] of €393m, adjusted net income, Group share amounted to €918m, an increase of +14.1% on 2016.
3. Q4 2017 performance in line with the first nine months
Business activity
Net inflows were strong (+€13.1bn), led by Retail and MLT Assets (+€10.4bn). By client segment, performance was uneven:
- Robust net inflows in Retail (+€14.2bn, o/w +€8.3bn excl. JVs), driven by growth in the international networks (particularly Italy) and third-party distributors (Europe, Japan). Net inflows from the French networks (+€1.0bn) and joint ventures (+€6.0bn) remained strong.
- Slight net outflow in the Institutionals segment (-€1.1bn) attributable to outflows in treasury products (seasonality effect) after significant net inflows recorded in the third quarter (+€18bn).
Results
- Accounting figures:
Accounting net income, Group share (including integration costs and the amortisation of distribution contracts) amounted to €209m, a 37% increase vs. 2016. Adjusted net income, Group share[20] was €269m, a 72.6% increase vs. 2016.
- Combined figures
At €751m, net revenues[21] were up 11.6%. This result is linked to growth in assets under management and strong results for performance fees (€82m) and financial revenues (€34m, attributable to disposals of minority interests). Thanks to a moderate increase in operating expenses[22] (+2.9%), the cost/income ratio[20] improved by 4.3 points to 50.8%. After tax[20], adjusted net income, Group share was €269m (+22%).
4. An attractive dividend policy
The Board of Directors has decided to propose a dividend of €2.50 per share in cash at the General Meeting to be held on 15 May 2018, i.e. an increase of +13.6% vs. 2016.
This proposed dividend represents a pay-out ratio of 65% of the Group's share of net income excluding integration costs (based on the number of shares at end-2017), and a 3.6% yield based on the share's closing price on 6 February 2018. Shares shall be designated ex-dividend on 22 May 2018 and dividends will be paid out as from 24 May 2018.
II.Strategic ambitions for 2018–2020
Amundi's ambition is to become one of the leaders in the global asset management industry, based on:
- the quality of the expertise and services it offers to its clients,
- its strong growth and profitability trends,
- its position as a committed financial player.
Strategic priorities
Amundi's successful growth momentum since its creation and its profitability reflect the effectiveness of its business model, which is based on the following principles:
- a client-centric organisational structure, both global and local,
- a policy of innovation allowing to bring to customers a wide range of expertises matching their expectations,
- robust infrastructure (particularly in IT),
- an entrepreneurial spirit.
For the 2018 to 2020 period, this strategy and this organization are confirmed. The integration of Pioneer has reinforced this business model in three key dimensions: distribution capabilities, expertises and talents.
Amundi is thus well positioned to continue its profitable growth, with two priorities:
- Consolidate its position as a reference partner in the Retail segment through its savings solutions for networks and distributors. Amundi will leverage on new growth drivers: partnership with the UniCredit networks (particularly in Italy, Germany, Austria and Eastern Europe), strong prospects in the French market, capacity to provide expertise in order to strengthen its relations with third-party distributors and joint venture.
- Accelerate its development in the Institutionals segment. Amundi seeks on one hand to increase its penetration rate on all geographic areas (Europe, Asia, US), and on the other hand to increase its market share leveraging its broad range of expertise, notably in US equities and emerging markets assets.
Moreover, Amundi also plans to strengthen its service provider positioning (IT, market access platform…) in order to cover the entire value chain.
As a responsible and recognized financial player, Amundi has made of social commitment one of its fundamental pillars since its creation in 2010. This policy will be continued in 3 directions:
- Mainstreaming ESG criteria in its investment policies, in addition to financial criteria. Socially Responsible Investing (SRI) AuM already amount to €168bn at end 2017, making Amundi one of the leaders in Europe.
- Strengthening its Impact Investing policy, notably via the fund Finance & Solidarités which AuM are expected to grow from €160m to €500m.
- Continuing its engagement approach towards issuers and its specific initiatives focused on climate change: JV with EDF for Energy transition financing, partnership with IFC[23] on green bonds…
As in previous years, Amundi’s strategy is based on organic growth, which explains most of the AuM increase since 2010.
However, targeted acquisition opportunities may be seized, provided they strengthen the business-model and meet the Group's financial criteria.
Financial objectives for 2018-2020
The financial objectives set for the 2018–2020 period are upgraded versus those announced at the IPO, and are the following:
- Activity: total net inflows of at least €150bn over 3 years (vs. €120bn for the previous period of 2016–2018), of which €60bn in Retail, €60bn in Institutionals and €30bn in JVs;
- Operational efficiency: cost/income ratio ≤ 53% (vs ≤ 55% previously), which includes some reinvestments aimed at fuelling future growth;
- Profitability: double the 2015 net income (the year of the IPO):
- accounting net income ≥ €1bn in 2020,
- adjusted net income ≥ €1.05bn, amounting to average annual growth of approximately 7% between 2017 [24] and 2020, vs.+5% before.
- Financial structure and dividend:
- Pay-out ratio at 65% of net income (excluding integration costs).
- CET1 ratio significantly above the regulatory minimum
III. Other items
Capital increase reserved for employees
A capital increase reserved for employees is planned for mid-2018[25]. This operation, meant to strengthen employees’ corporate spirit following the Pioneer acquisition, will be carried out in the context of existing legal powers as approved by the General Shareholders’ Meeting of May 2017.
The impact of this capital increase on net earnings per share should be negligible: the maximum number of shares to be issued is 900,000 (i.e., less than 0.5% of capital and voting rights), and the discount offered to employees is expected to be similar to that offered during the first capital increase reserved for employees in December 2015 (20%).
Nomination of a new member at the Board
Amundi’s Board has decided to appoint Gianni Franco Papa, General Manager of UniCredit, as non-voting member, representing UniCredit, the new partner network of Amundi. He is taking over from François Veverka.
Financial disclosure schedule
- 27 April 2018: Publication of first-quarter 2018 results
- 15 May 2018: General Shareholders’ Meeting
- 22 May 2018: Ex-dividend date
- 24 May 2018: Dividend pay-out date
- 2 August 2018: Publication of first-half 2018 results
- 26 October 2018: Publication of results for the first nine months of 2018
***
[10] Combined data for Amundi + Pioneer
[11] Excluding the costs associated with the integration of Pioneer (€135m before tax and €88m after tax in 2017) and excluding the amortisation of distribution contracts (€44m before tax and €30m after tax in 2017)
[12] Excluding integration costs in 2017. Computed on an Accounting EPS, compounded annual growth is +5.8%.
[13] Excl. JVs
[14] Source Deutsche Bank ETF Market review at end December 2017
[15] Accounting figures include Pioneer data only since the effective acquisition date (3rd of July 2017). Therefore, Amundi’s accounting figures include Pioneer data only in the 2nd half of 2017. In 2016 Amundi’s accounting figures do not include Pioneer data
[16] Excluding the costs associated with the integration of Pioneer (€135m before tax and €88m after tax in 2017) and excluding the amortisation of distribution contracts (€44m before tax and €30m after tax in 2017)
[17] Combined data in 2016 and 2017: 12 months Amundi + 12 months Pioneer
[18] Excluding amortisation of distribution contracts (UniCredit, SG, and Bawag)
[19]Excluding costs associated with the integration of Pioneer Investments
[20] Excluding amortisation of distribution contracts and Pioneer integration costs
[21] Excluding amortisation of distribution contracts
[22] Excluding costs associated with the integration of Pioneer Investments
[23] International Finance Corporation, a subsidiary of the World Bank.
[24] Net income for 2017 combined and adjusted, including a normalised level of financial income
[25] Subject to necessary approvals
Activity: total net inflows of at least €150bn over 3 years, of which:
- €60bn in Retail,
- €60bn in Institutionals,
- €30bn in JVs
Operational efficiency: cost/income ratio ≤ 53%, including some reinvestments aimed at fuelling future growth.
Profitability: double the 2015 net income (the year of the IPO):
- accounting net income ≥ €1bn in 2020,
- adjusted net income ≥ €1.05bn, equivalent to an average annual growth of approximately 7% between 2017 [26] and 2020.
Financial structure and dividend:
- Pay-out ratio at 65% of net income (excluding integration costs)
- CET1 ratio significantly above the regulatory minimum
Assumptions
These objectives are based on the following assumptions:
- absence of market effect during the period,
- stable average margin on assets under management (excluding JVs).
Key sensitivities
|
Changes in the equity markets |
+/- 10% |
|
+/- €25/30bn in Assets under Management (AUM) |
|
+/- €80–85m in net revenues |
|
Changes in interest rates |
+/- 100 pts |
|
-/+ €30-35bn in Assets under Management (AUM) |
|
-/+ €35–40m in net revenues |
These sensitivities do not include an indirect effect on net inflows from market fluctuations.
***
[26] Combined and adjusted net income for 2017, with a normalised level of financial income
|
€m |
2017 |
2016 |
Change |
Q4.2017 |
Q4.2016 |
Change |
||||||
|
Net revenue (2) |
2,301 |
1,694 |
35.8% |
751 |
447 |
68.0% |
||||||
|
o/w net management fees |
|
2,029 |
|
1,510 |
|
34.4% |
|
636 |
|
388 |
|
63.7% |
|
o/w performance fees |
|
175 |
|
115 |
|
52.2% |
|
82 |
|
28 |
|
NS |
|
o/w Net financial income and other net income (2) |
|
97 |
|
69 |
|
40.9% |
|
34 |
|
31 |
|
8.3% |
|
Adjusted operating expenses (3) |
-1,173 |
-878 |
33.7% |
-381 |
-236 |
61.8% |
||||||
|
Adjusted gross operating income (2) (3) |
1,128 |
816 |
38.2% |
370 |
212 |
74.9% |
||||||
|
Adjusted cost/income ratio 2 3 |
|
51.0% |
|
51.8% |
|
-0.8 pt |
|
50.8% |
|
52.7% |
|
-1.9 pt |
|
Cost of risk & Other |
|
-15 |
|
-1 |
|
NS |
|
-8 |
|
0 |
|
NS |
|
Equity-accounted entities |
|
33 |
|
28 |
|
16.3% |
|
9 |
|
8 |
|
11.8% |
|
Income before tax (2) (3) |
1,146 |
844 |
35.8% |
370 |
219 |
69.1% |
||||||
|
Taxes 2 3 |
-347 |
-264 |
31.5% |
-102 |
-63 |
60.9% |
||||||
|
Adjusted net income, Group share (2) (3) |
800 |
579 |
38.0% |
269 |
156 |
72.6% |
||||||
|
Amortisation of distribution contracts after tax |
-30 |
-11 |
NS |
-12 |
-3 |
NS |
||||||
|
Amundi net income, Group share before integration costs |
769 |
568 |
35.4% |
256 |
153 |
67.6% |
||||||
|
Pioneer integration costs after tax |
-88 |
0 |
NS |
-47 |
0 |
NS |
||||||
|
Net income, Group share |
681 |
568 |
19.9% |
209 |
153 |
37.0% |
||||||
|
EPS (€) |
3.54 |
|
3.40 |
|
4.3% |
|
|
|
|
|
|
|
|
Adjusted EPS (€) |
4.16 |
|
3.46 |
|
20.0% |
|
|
|
|
|
|
(1) Accounting income: in 2017 and 2016, the information consists of:
- For 2017: data for Amundi (12 months of activity) and Pioneer Investments (six months of activity).
- For Q4: data for Amundi (Q4) and Pioneer Investments (Q4).
Adjustments Restatement of net accounting revenues from the amortisation of distribution contracts (UniCredit as from 1 July 2017, SG and Bawag in 2016 and 2017), and restatement of 2017 accounting operating expenses for Pioneer integration costs. These two items are shown net of taxes in the table above.
(2) Excl. amortisation of distribution contracts
(3) Excl. Pioneer integration costs
|
€m |
2017 |
2016 |
Change |
Q4.2017 |
Q4.2016 |
Change |
||||||
|
Net revenue (2) |
2,722 |
2,533 |
7.5% |
751 |
673 |
11.6% |
||||||
|
o/w net management fees |
|
2,445 |
|
2,327 |
|
5.1% |
|
636 |
|
597 |
|
6.4% |
|
o/w performance fees |
|
180 |
|
133 |
|
35.1% |
|
82 |
|
44 |
|
85.8% |
|
Net financial income and other net income (2) |
|
97 |
|
73 |
|
32.9% |
|
34 |
|
31 |
|
8.3% |
|
Adjusted operating expenses 3 |
-1,428 |
-1,399 |
2.1% |
-381 |
-371 |
2.9% |
||||||
|
Adjusted gross operating income 2 3 |
1,295 |
1,134 |
14.2% |
370 |
302 |
22.4% |
||||||
|
Adjusted cost/income ratio (2) (3) |
|
52.4% |
|
55.2% |
|
-2.8 pts |
|
50.8% |
|
55.1% |
|
-4.3 pts |
|
Cost of risk & Other |
|
-16 |
|
-5 |
|
NS |
|
-8 |
|
-1 |
|
NS |
|
Equity-accounted entities |
|
33 |
|
28 |
|
16.3% |
|
9 |
|
8 |
|
11.8% |
|
Income before tax (2) (3) |
1,311 |
1,158 |
13.3% |
370 |
309 |
19.9% |
||||||
|
Taxes (2) (3) |
-393 |
-352 |
11.8% |
-102 |
-88 |
15.2% |
||||||
|
Adjusted net income, Group share (2) (3) |
918 |
805 |
14.1% |
269 |
220 |
22.0% |
||||||
|
Amortisation of distribution contracts after tax |
-30 |
-11 |
NS |
-12 |
-3 |
NS |
||||||
|
Pioneer integration costs after tax |
-88 |
0 |
NS |
-47 |
0 |
NS |
||||||
|
Net income, Group share |
800 |
794 |
0.8% |
210 |
218 |
-3.7% |
1. Combined income: in 2017 and 2016, the information consists of:
- For 2017: combined data for Amundi (12 months of activity) and Pioneer Investments (12 months of activity).
- For Q4: combined data for Amundi (Q4) and Pioneer Investments (Q4).
Adjustments: restatement of net revenues from the amortisation of distribution contracts (UniCredit as from 1 July 2017, SG and Bawag in 2016 and 2017), and restatement of 2017 accounting operating expenses for Pioneer integration costs. These two items are shown net of taxes in the table above.
(2) Excl. amortisation of distribution contracts
(3) Excl. Pioneer integration costs
|
(€bn) |
AuM |
Net inflows |
Market effect |
Scope effect |
|||
|
At 31/12/2015 |
985 |
|
|
|
|||
|
Flows in Q1 2016 |
+13.8 |
-11.6 |
/ |
||||
|
At 31/03/2016 |
987 |
|
|
|
|||
|
Flows in Q2 2016 |
+3.0 |
+13.6 |
/ |
||||
|
At 30/06/2016 |
1,004 |
|
|
|
|||
|
Flows in Q3 2016 |
+22.3 |
+19.7 |
+8.6 |
KBI GI |
|||
|
At 30/09/2016 |
1,054 |
|
|
|
|||
|
Flows in Q4 2016 |
+23.1 |
+0.1 |
+5.0 |
CAI Investors |
|||
|
At 31/12/2016 |
1,083 |
|
|
|
|||
|
Flows in Q1 2017 |
+32.5 |
+12.5 |
/ |
||||
|
At 31/03/2017 |
1,128 |
|
|
|
|||
|
Flows in Q2 2017 |
|
-3.7 |
-3.1 |
/ |
|
||
|
At 30/06/2017 |
1,121 |
|
|
|
|
||
|
Integration of Pioneer Investments |
/ |
/ |
/ |
+242.9 |
Pioneer |
||
|
Flows in Q3 2017 |
|
+31.2 |
+5.3 |
/ |
|
||
|
At 30/09/2017 |
1,400 |
|
|
|
|
||
|
Flows in Q4 2017 |
|
+13.1 |
+12.7 |
/ |
|
||
|
At 31/12/2017 |
1,426 |
|
|
|
|
||
|
|
AuM |
AuM |
% chg. |
Inflows |
Inflows |
Inflows |
Inflows |
Inflows |
||||
|
(€bn) |
31/12/2017 |
31/12/2016 |
12M 2017 |
12M 2016 |
Q4-17 |
Q3-17 |
Q4-16 |
|||||
|
French networks* |
107 |
100 |
+7.3% |
+4.0 |
-2.6 |
+1.0 |
+1.8 |
+1.7 |
||||
|
International networks & JVs |
236 |
206 |
+14.8% |
+28.0 |
+26.8 |
+8.4 |
+7.0 |
+12.6 |
||||
|
Third-party distributors |
181 |
163 |
+11.2% |
+17.6 |
+7.3 |
+4.8 |
+4.3 |
+5.2 |
||||
|
Retail |
524 |
469 |
+11.9% |
+49.6 |
+31.5 |
+14.2 |
+13.1 |
+19.5 |
||||
|
Institutionals** & sovereigns |
354 |
340 |
+4.2% |
+10.8 |
+17.1 |
-5.3 |
+11.3 |
-2.0 |
||||
|
Corporates & employee savings |
129 |
115 |
+11.6% |
+7.9 |
+13.8 |
+5.0 |
+6.3 |
+11.8 |
||||
|
CA & SG insurers |
419 |
405 |
+3.4% |
+2.3 |
-2.0 |
-0.8 |
+0.4 |
-7.7 |
||||
|
Institutionals |
902 |
860 |
+4.8% |
+21.0 |
+28.9 |
-1.1 |
+18.0 |
+2.1 |
||||
|
TOTAL |
1,426 |
1,329 |
+7.3% |
+70.6 |
+60.4 |
+13.1 |
+31.2 |
+21.6 |
||||
|
o/w JVs |
118 |
99 |
+18.3% |
+17.8 |
+24.8 |
+6.0 |
+4.6 |
+12.3 |
* French networks: net inflows on medium/long-term assets +€4.4bn in 2017, o/w +€0.9bn in Q4 2017
** Including Funds of funds
|
(€bn) |
AuM 31/12/2017 |
AuM 31/12/2016 |
% chg. |
Inflows 12M 2017 |
Inflows 12M20 16 |
Inflows Q4-17 |
Inflows Q3-17 |
Inflows Q4-16 |
||||
|
Equities |
232 |
200 |
+16.2% |
+10.7 |
+10.5 |
+3.7 |
+2.9 |
+1.3 |
||||
|
Diversified |
255 |
231 |
+10.6% |
+18.9 |
+12.1 |
+5.7 |
+4.9 |
+3.8 |
||||
|
Bonds |
646 |
644 |
+0.3% |
+3.8* |
+21.3 |
-0.2 |
+7.0 |
+12.5 |
||||
|
Real, alternative and structured assets |
70 |
65 |
+7.8% |
+2.8 |
+1.3 |
+1.2 |
-0.1 |
+0.9 |
||||
|
MLT ASSETS |
1,203 |
1,140 |
+5.6% |
+36.2 |
+45.3 |
+10.4 |
+14.7 |
+18.5 |
||||
|
Treasury products |
223 |
189 |
+17.7% |
+34.4 |
+15.2 |
+2.7 |
+16.4 |
+3.1 |
||||
|
TOTAL |
1,426 |
1,329 |
+7.3% |
+70.6 |
+60.4 |
+13.1 |
+31.20 |
+21.6 |
* Impact of the ECB’s reinternalisation of a mandate in Q1 2017 for -€6.9bn
|
|
AuM |
AuM |
% chg. |
Inflows |
Inflows |
Inflows |
Inflows |
Inflows |
||||
|
(€bn) |
31/12/2017 |
31/12/2016 |
12M 2017 |
12M 2016 |
Q4-17 |
Q3-17 |
Q4-16 |
|||||
|
France |
841* |
800 |
+5.1% |
+19.4 |
+16.0 |
-8.3 |
+19.3 |
-1.7 |
||||
|
Europe excl. France |
325 |
295 |
+10.0% |
+22.9 |
+18.3 |
+10.8 |
+4.4 |
+9.6 |
||||
|
Asia |
177 |
153 |
+15.9% |
+23.6 |
+26.7 |
+8.3 |
+7.1 |
+13.3 |
||||
|
Rest of world |
83 |
81 |
+3.0% |
+4.7 |
-0.6 |
+2.3 |
+0.3 |
+0.4 |
||||
|
TOTAL |
1,426 |
1,329 |
+7.3% |
+70.6 |
+60.4 |
+13.1 |
+31.2 |
+21.6 |
||||
|
TOTAL excl. FRANCE |
585 |
529 |
+10.7% |
+51.2 |
+44.4 |
+21.4 |
+11.8 |
+23.3 |
* o/w €405 for Group insurers
- 2017 Income statement
- Accounting data
In 2017, the data corresponds to 12 months of activity for Amundi and six months of Pioneer's activity since 1 July 2017. In 2016, the data corresponds to 12 months of activity for Amundi
To present an income statement that is closer to the economic reality, the following adjustments have been made:
- in 2017: restatement of Pioneer-related integration costs,
- in 2016 and 2017: amortisation of distribution contracts (deducted from net revenues) with SG and BAWAG and, starting in Q3 2017, with UniCredit.
- Combined data
In 2017 and 2016, the data includes:
- For the year: combined data for Amundi (12 months of activity) and Pioneer (12 months of activity).
- For Q4: combined data for Amundi (Q4) and Pioneer (Q4).
Pioneer data for 2016 and H1 2017 include the following items:
- Scope affected by the transaction (excluding Poland and India)
- Normalisation of Pioneer's tax rate
The combined data are different from the pro forma data (as presented in the 2016 Registration Document), which included restatements for the financing assumptions of the acquisition of Pioneer: additional financing costs reduced financial income.
- Note on accounting and combined figures
Costs associated with the integration of Pioneer Investments:
- FY 2017: €135m before tax and €88m after tax
- Q4 2017: €77m before tax and €47m after tax
Amortisation of distribution contracts:
- FY 2017: €44m before tax (€30m net of tax)
- Q4 2017: €18m before tax (€12m net of tax)
- Amortisation of distribution contracts with UniCredit
When Pioneer was acquired, 10-year distribution contracts were entered into with UniCredit networks in Italy, Germany, Austria, and the Czech Republic; the gross valuation of these contracts came to €546m (posted to the balance sheet under Intangible Assets). At the same time, a Deferred Tax Liability of €161m was recognised. Thus the net amount is €385m which will be amortised using the straight-line method over 10 years, as from 1 July 2017.
In the Group's income statement, the net tax impact of this amortisation will be €38m over a full year (€55m before taxes), posted under "Other revenues," and will be added to existing amortisations of the SG and Bawag distribution contracts of €11m net of taxes over a full year (€17m before taxes).
- Alternative Performance Indicator
Adjusted net income
In order to present a performance indicator that is closer to economic reality, Amundi publishes adjusted net income, which is reconciled with accounting net income, Group share in the following manner:
|
€m |
2017(1) |
2016(2) |
|
Accounting net income, Group share |
681 |
568 |
|
+ Integration costs after tax |
+88 |
0 |
|
+ Amortisation of distribution contracts after tax |
+30 |
+11 |
|
Adjusted net income, Group share |
800 |
579 |
(1) 12 months for Amundi and six months for Pioneer (2) 12 months for Amundi
Combined net income
To appraise the new Group's performance on a comparable basis, Amundi also publishes combined net income, which includes 12 months of Pioneer's income in 2016 and six months of Pioneer's income in 2017:
|
€m |
2017 |
2016 |
|
Accounting net income, Group share |
681 |
568 |
|
+ Pioneer's income in H1 2017 |
+119 |
/ |
|
+ Pioneer's income in 2016 |
/ |
+226 |
|
Combined net income, Group share |
800 |
794 |
Shareholder structure
|
31 December 2015 |
31 December 2016 |
31 December 2017 |
||||
|
(shares) |
% interest |
(shares) |
% interest |
(shares) |
% interest |
|
|
Crédit Agricole Group |
126,321,001 |
75.5% |
127,001,233 |
75.6% |
141,057,399 |
70.0% |
|
Employees |
453,557 |
0.3% |
413,753 |
0.2% |
426,085 |
0.2% |
|
Free float |
40,470,679 |
24.2% |
40,449,438 |
24.1% |
59,985,943 |
29.8% |
|
Shares controlled by the company (liquidity programme) |
0 |
0.0% |
61,045 |
0.1% |
41,135 |
0.02% |
|
Number of shares at end of period |
167,245,237 |
100.0% |
167,925,469 |
100.0% |
201,510,562 |
100.0% |
|
Average number of shares for the period |
166,810,578 |
/ |
167,366,374 |
/ |
192,401,181 |
/ |
- Average number of shares for 2015, 2016 and 2017 calculated on a pro-rata basis

About Amundi
About Amundi
Amundi, the leading European asset manager, ranking among the top 10 global players[1], offers its 100 million clients - retail, institutional and corporate - a complete range of savings and investment solutions in active and passive management, in traditional or real assets. This offering is enhanced with IT tools and services to cover the entire savings value chain. A subsidiary of the Crédit Agricole group and listed on the stock exchange, Amundi currently manages more than €2.3 trillion of assets[2].
With its six international investment hubs[3], financial and extra-financial research capabilities and long-standing commitment to responsible investment, Amundi is a key player in the asset management landscape.
Amundi clients benefit from the expertise and advice of 5,600 employees in 35 countries.
Amundi, a trusted partner, working every day in the interest of its clients and society
Footnotes
- ^ [1] Source: IPE "Top 500 Asset Managers" published in June 2024 based on assets under management as of 31/12/2023
- ^ [2] Amundi data as at 31/03/2025
- ^ [3] Paris, London, Dublin, Milan, Tokyo and San Antonio (via our strategic partnership with Victory Capital)
Footnotes